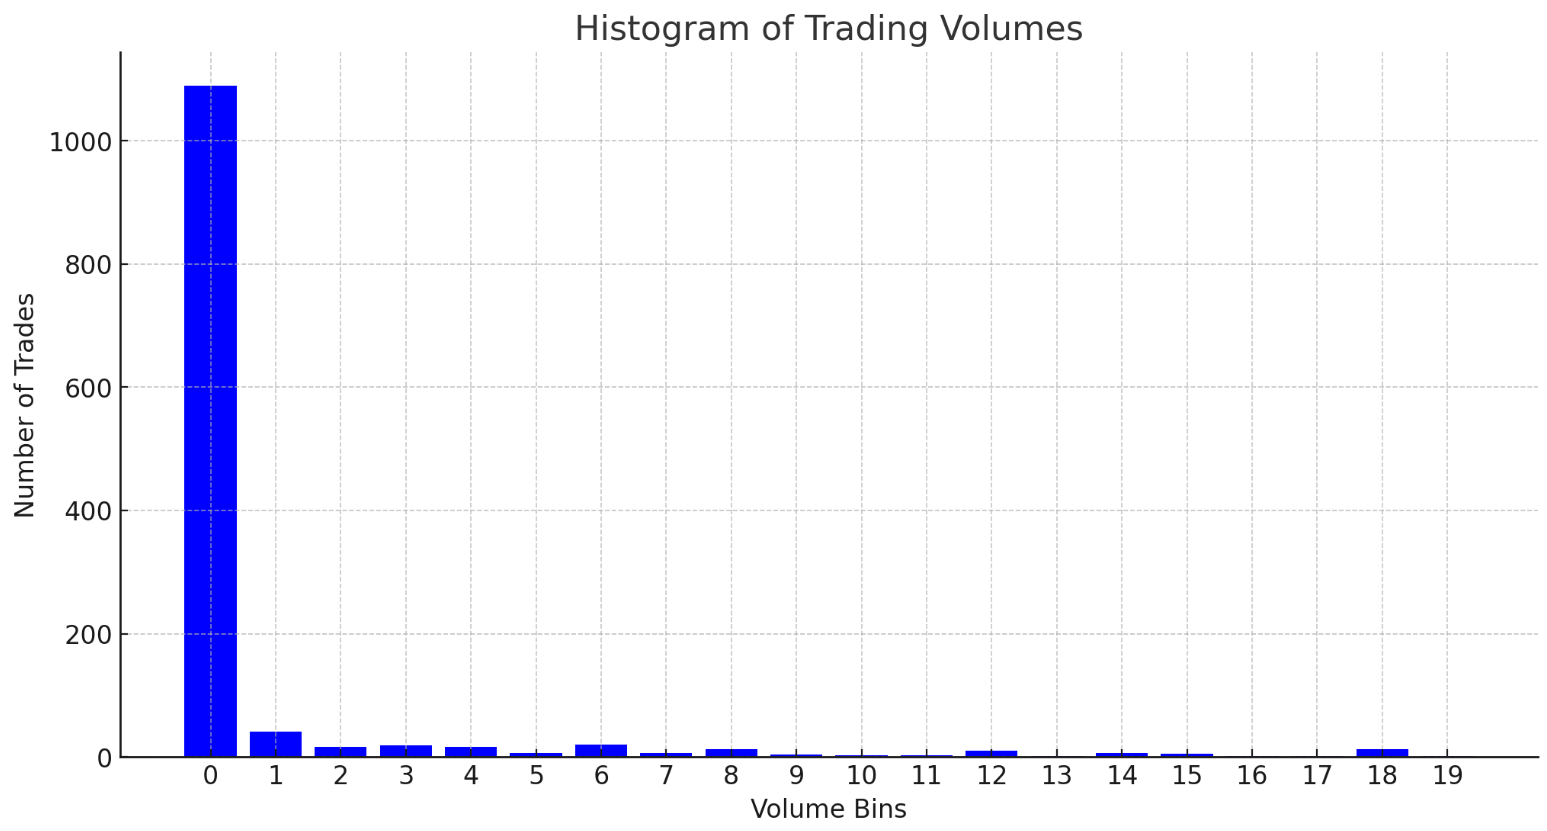
Volume distribution analysis
Volume Distribution
The Volume Distribution Metric is a statistical measure used to analyze the distribution of trading volumes in financial datasets. The trade size distribution is a straightforward way to visually represent the sizes of executed transactions and the number of occurences in a histogram. This metric is particularly useful in cryptocurrency trading, where it can reveal insights about market behavior and investor sentiment. In the context of trading, understanding volume distribution can help in identifying trends, trading volumes at different price levels, and the potential impact of large trades.
Mathematical Background
To calculate volume distribution, we generally create a histogram representing the frequency of various volume ranges. The histogram bins the volume data into dinamic ranges and counts the occurrences in each bin. This can reveal, for example, if most trades are occurring at low, medium, or high volume levels.
Metric in the API Response
volumedist: This metric provides a histogram of trading volumes. Each of 100 bins in the histogram represents a range of trading volumes, and the value represents the count of trades within that volume range.
 {
    "timestamp": "2024-01-15T18:11:00.000Z",
    "marketvenue": "binance",
    "pairid": "btc-usdt",
    "volumedist": [
      [
        0,
        2586
      ],
      [
        1,
        31
      ],
      [
        2,
        8
      ],
      [
        3,
        16
      ],
      [
        4,
        11
      ],
      [
        5,
        7
      ],
      [
        6,
        8
      ],
      [
        7,
        3
      ],
      [
        8,
        1
      ],
      [
        9,
        4
      ],
      [
        10,
        2
      ],
      [
        11,
        4
      ]
        ...
    ]
 }
Usage Example
Consider trading data from the Binance market for the BTC-USDT pair. The volumedist metric in the API response provides a distribution of trading volumes.
For instance, consider the following simplified data excerpt from the volumedist metric:
- Bin 0-1: 1000 trades
- Bin 1-2: 100 trades
- Bin 2-3: 50 trades
Steps to analyze:
- Build a histogram visualization.
- Analyze the histogram to understand the distribution of trading volumes.
The histogram will visually represent how many trades occurred at different volume levels, helping to identify if most trades are small, medium, or large in volume.
Visuals

Here is the histogram representing the trading volumes based on the provided sample data. Each bar in the histogram corresponds to a volume bin, and the height of the bar indicates the number of trades within that volume range. This visual representation helps in understanding the distribution of trading volumes, which can be crucial for market analysis and decision-making in cryptocurrency trading.
Interpretation
- Ideally, trading volume should follow a power law heavy tail distribution, where small trades are common, and large trades are rare.
- A more uniform distribution might suggest a healthy mix of small and large volume trades.
Applications in Market Surveillance
- Detecting Wash Trading: Unnatural uniformity in trade sizes across many bins could indicate potential wash trading.
- Identifying Participant Changes: Shifts in high volume bins may reveal changing behaviors of large traders.
- Uncovering Coordinated Tactics: Similar volume distribution patterns concurrently emerging across exchanges may suggest coordinated behaviors.
- Establishing Expected Profiles: Calculate historical volume distributions to detect anomalies outside anticipated patterns.
- Impact Analysis: Analyze volume ranges with highest frequency to assess potential market impact.
Considerations for Cryptocurrencies
- Emergence of institutional traders alongside retail participants
- Prevalence of high frequency trading with small, repetitive order sizes
- Fragmented liquidity across exchanges
Key Takeaways
- Volume Distribution analyzes trade size frequencies across bins.
- Changes can reveal shifting market participant behaviors.
- Conforming distributions may indicate wash trading risks.
- Integration with other metrics provides robust surveillance.
 Distributed Networks Institute