VWAP (Volume-Weighted Average Price) #
VWAP is a trading benchmark that calculates the average price of a security, factoring in both its price and volume. It gives a weighted average price where the weights are the volumes traded at each price point. VWAP is significant as it provides insight into both the trend and value of the cryptocurrency.
Mathematical Background #
VWAP is calculated using the formula:
\[{VWAP} = \frac{\sum ({Price} \times{Volume})}{\sum {Volume}}\]where Price is the price at which the trades occur and Volume is the sum of the executed trades within the defined time period.
Metric in the API Response #
vwap: This metric returns the VWAP of a specific trading pair over a defined period (selected in gran parameter).
Trade Count #
Trade count is a metric that measures the total number of trades executed for a particular trading pair within a specific timeframe (granularity). This metric is useful for assessing market activity and liquidity.
Metric in the API Response #
tradecount: This metric provides the total number of trades that have occurred for a specific trading pair in a given period.
Example #
{
    "timestamp": "2023-12-27T00:00:00.000Z",
    "marketvenueid": "okx",
    "pairid": "btc-usdt",
    "vwap": 42519.5964,
    "tradecount": 606
}
Usage Example and Visuals #
Analyzing the market data for okx-btc-usdt on December 25-27, 2023:
- Retrieve the VWAP and the trade count to understand the average price, and trading volume and gauge market activity and liquidity.
- Vizualise the data to enhance the understanding of market trends and behavior
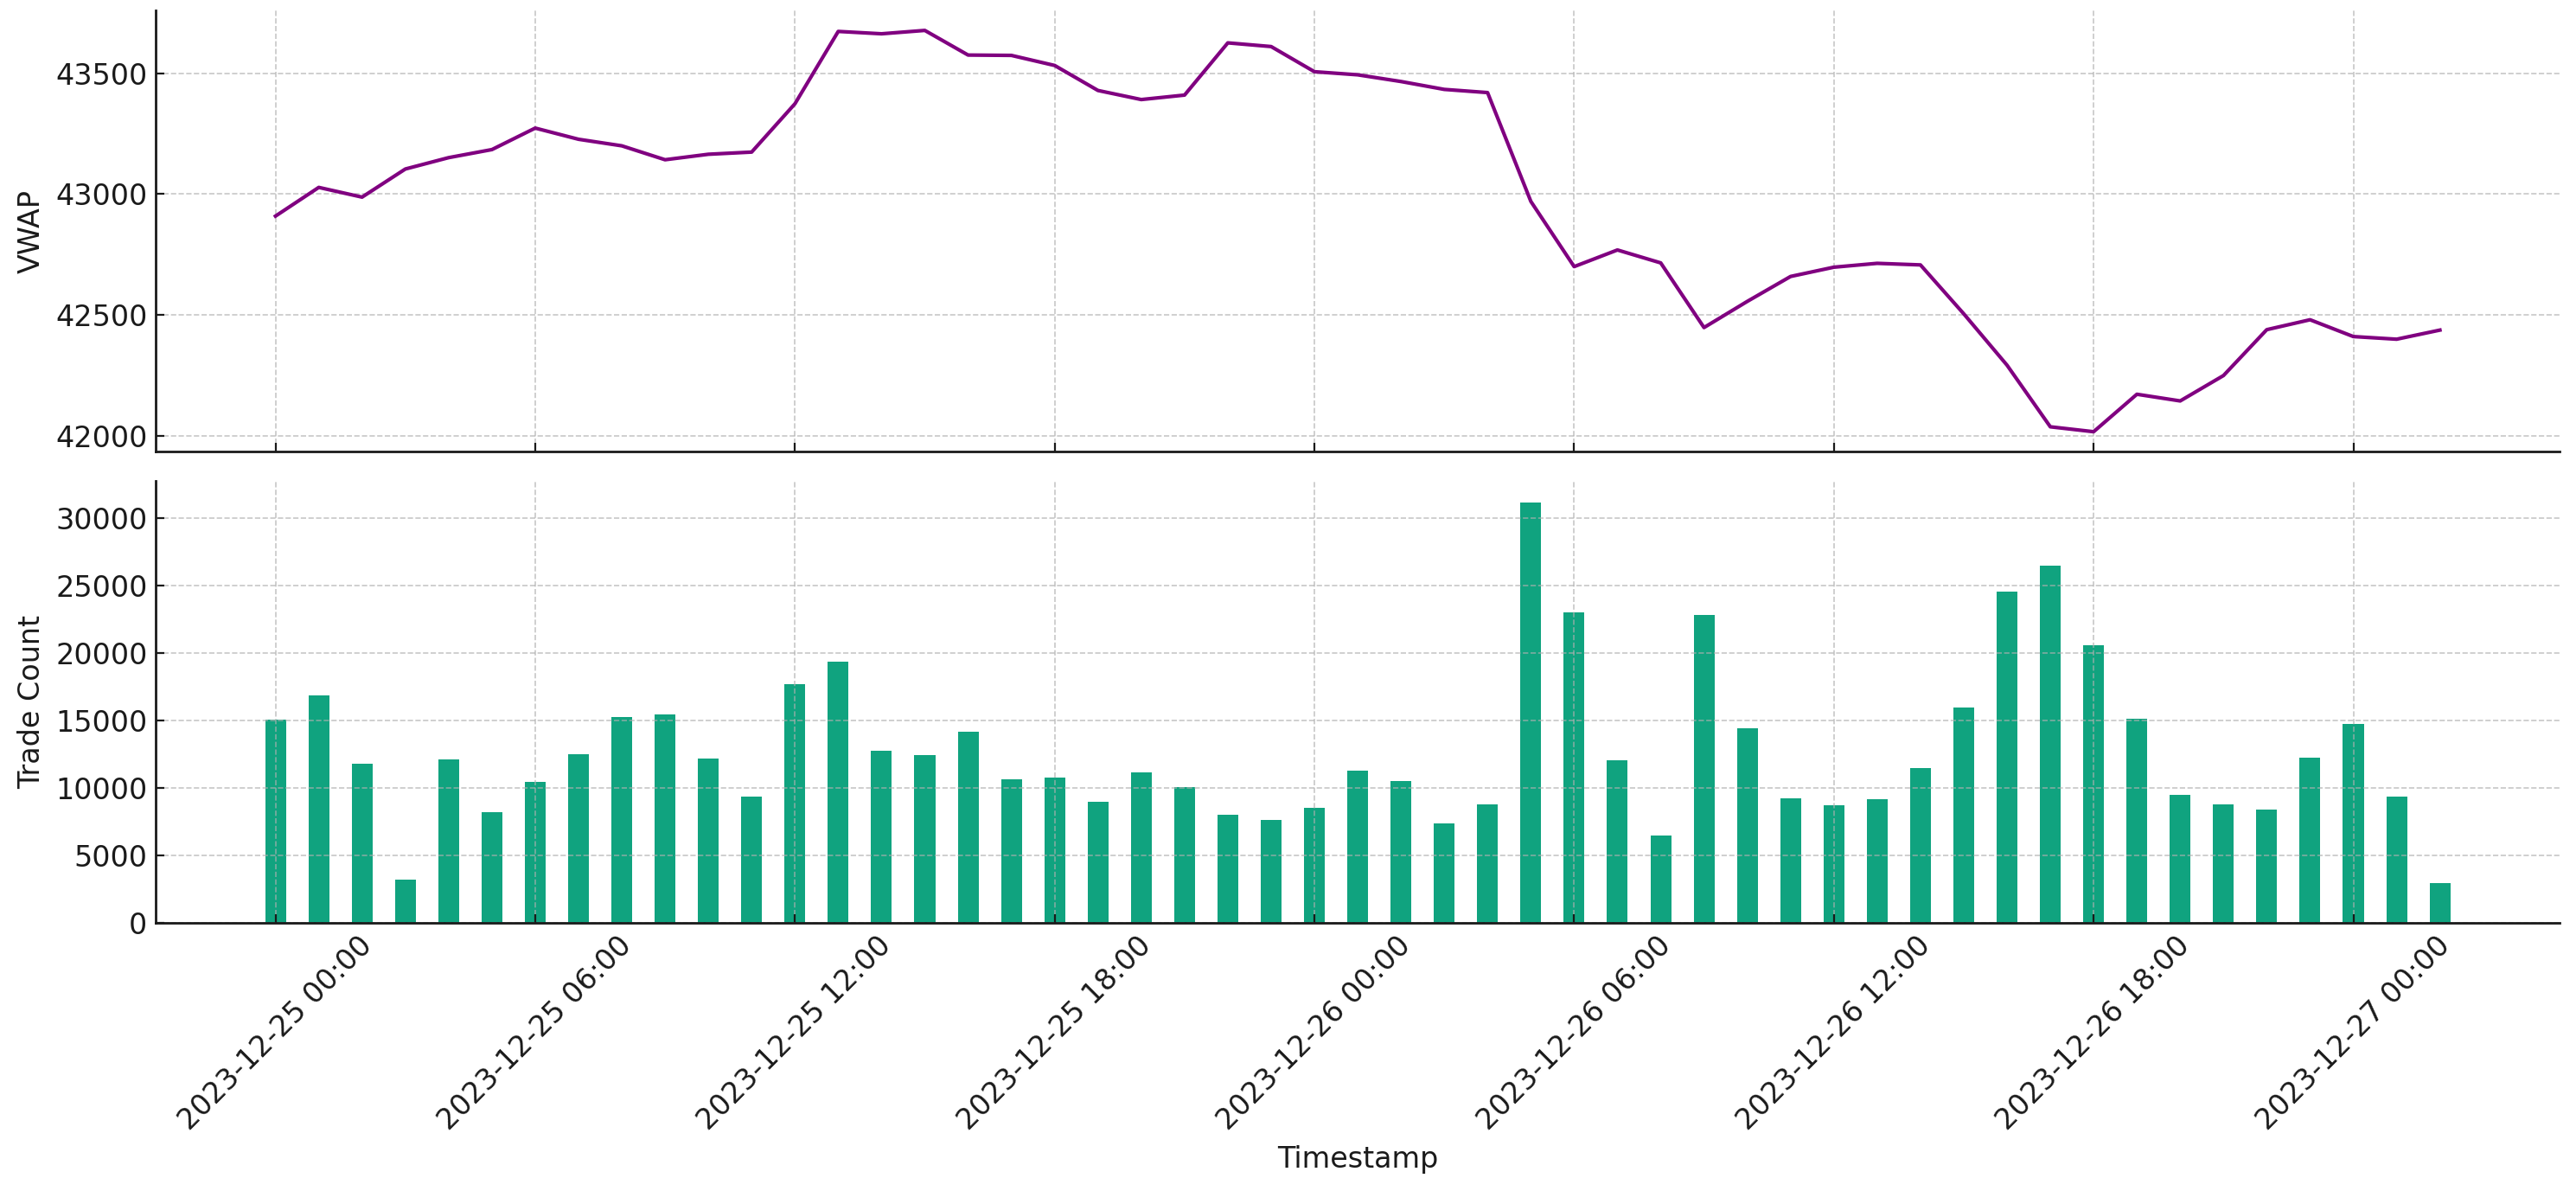
VWAP and Trade Count on OKX BTC-USDT pair, December 25-27, 2023.
VWAP (Volume Weighted Average Price): The VWAP line appears to be above the closing prices initially, indicating that earlier trades were happening at prices above the average. However, as time progresses, the VWAP gets closer to the closing price line, suggesting that the trading prices are aligning more closely with the average. This could mean the market is stabilizing or that volume is decreasing.
Trade Count: The bar chart at the bottom represents the trade count during each time interval. There’s a significant peak in the middle of the period, indicating a period of high trading activity. This spike could be due to a news event, market announcement, or other stimuli causing a sudden increase in trading interest.
Based on this visual information, we can infer that during the observed time period, the Bitcoin market experienced a phase of relatively stable prices with a period of increased trading activity in the middle. The VWAP trend suggests that the price movement was near the average traded prices over time, showing no significant divergence from typical trading patterns.
Applications in Market Surveillance #
Establishing Baselines: VWAP and Trade Count provide baseline understanding of market activity. Significant deviations in these metrics can indicate anomalies.
Wash Trading Detection: Analyzing VWAP and trades count can identify potential wash trading, such as prices not impacting VWAP.
Considerations for Cryptocurrencies #
- Lower liquidity exaggerating individual trade impact on VWAP
- Changing participant profiles influencing trading volumes
Key Takeaways #
- VWAP and trades provide pricing, volume, and activity baseline.
- Significant deviations may signal anomalies.
- Contextualizes other metrics like volatility and trade sizes.
- Helps identify order imbalances and changing behaviors.